Continuous Improvement
How to Calculate Manufacturing Efficiency in Excel
Specifically, this covers labor efficiency — planned hours against actual hours — which can help identify jobs that need process review.
Basic formula
Efficiency % = Planned Hours ÷ Actual Hours × 100
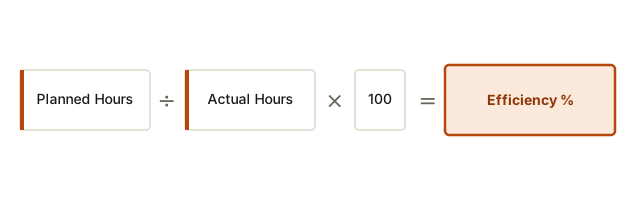
This is a labor efficiency metric — sometimes called job or performance efficiency — and it compares how long a job was estimated to take against how long it actually took. It differs from utilization and OEE: utilization looks at how much available capacity was used at all, while OEE (Overall Equipment Effectiveness) is a broader equipment metric — Availability × Performance × Quality — that also accounts for speed losses and defective output, not just whether the machine was running.
Excel formula
If planned hours are in cell B2 and actual hours are in C2:
=IFERROR(B2/C2,"")
Format the result as a percentage.
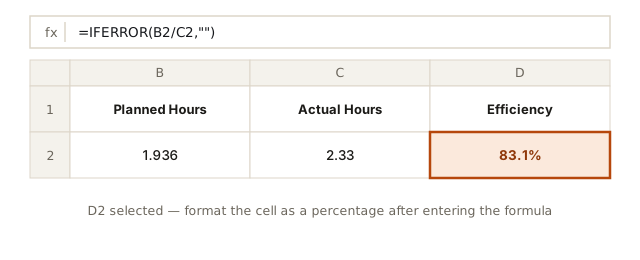
IFERROR exists for data hygiene, not business logic: a job with zero actual hours logged, whether from a data-entry gap or a job that hasn't started yet, would otherwise throw #DIV/0! and break any report or chart built downstream of the cell. Returning a blank rather than 0 matters here too — a job showing 0% efficiency reads as "this job performed terribly," when the real cause is usually that no hours have been logged yet. A blank cell doesn't make that false claim, and it's easy to filter out of a report where a false zero wouldn't be.
Example
Planned time: 1.936 hours. Actual time: 2.33 hours.
Efficiency = 1.936 ÷ 2.33 × 100 = approximately 83.1%.
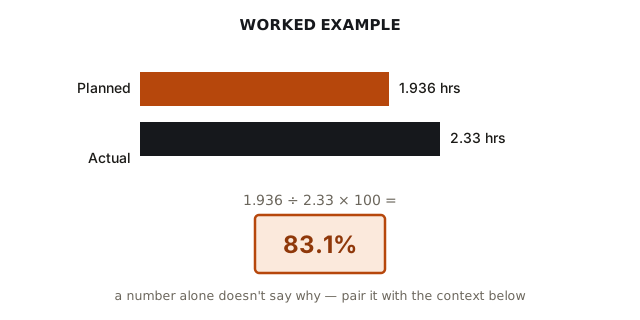
2.33 actual hours against 1.936 planned hours means the job took about 20% longer than estimated (2.33 ÷ 1.936 ≈ 1.203), which is where the 83.1% comes from — the formula is just the inverse of that ratio, scaled to a percentage.
Scenario: two or more people on the same job
The formula doesn't change — what changes is what counts as "actual hours." A crew job should be measured in total labor-hours, not any one person's clock time or the job's elapsed duration. If John logs 4.5 hours and Maria logs 4.2 hours on the same job, the job's actual labor-hours are 8.7, not 4.5 and not 4.2.
Planned hours should also be expressed in labor-hours, and that total should come from the original routing or labor standard as written — not adjusted after the fact based on how many people happened to work the job. A standard of "4 hours" for a job is 4 labor-hours, full stop. If two people complete that same job in 2 clock-hours each, that's 2 × 2 = 4 labor-hours actual against 4 labor-hours planned — 100% efficiency, correctly reflecting that adding a second person didn't cost or save anything on paper. Multiplying the planned hours by headcount after the fact (turning a 4-hour standard into an 8-hour one because two people showed up) would make that same job look like 200% efficiency — which doesn't mean the crew was twice as productive, it means the math was built to reward adding people rather than to measure the work.
| Job | Planned (crew) | John | Maria | Total actual |
|---|---|---|---|---|
| 4521 | 8.0h | 4.5h | 4.2h | 8.7h |
In Excel, keep one row per person per job in a time log, then total each job's hours with SUMIF before applying the efficiency formula:
=SUMIF(JobID_range, "4521", ActualHours_range)
Then feed that total into the same formula as before: =IFERROR(PlannedHours/SUMIF(JobID_range,"4521",ActualHours_range),0). For 4521 above: 8.0 ÷ 8.7 × 100 ≈ 91.9%.
Scenario: one person or crew across multiple jobs
This is where the basic formula quietly breaks if you're not careful. To get a shift, day, or week's overall efficiency across several jobs, the instinct is to average each job's percentage. That's wrong, and it can be wrong by a lot.
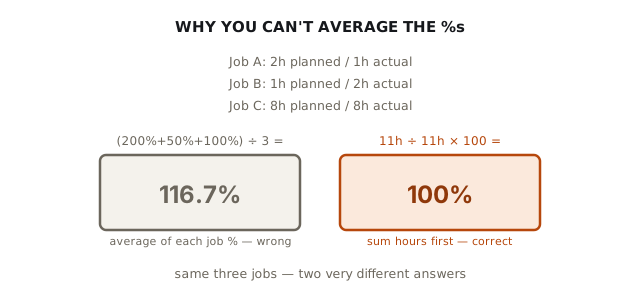
Sum the planned hours for the period, sum the actual hours for the period, and divide those two totals — the same formula, just applied once to the totals instead of once per job. Never average a column of individual efficiency percentages; a handful of very short jobs with wide swings can drag or inflate the average without reflecting how the day actually went.
Correct — sum first: =SUM(PlannedHours_range)/SUM(ActualHours_range)
Wrong — average of percentages: =AVERAGE(EfficiencyPercent_range)
Scenario: a job that spans multiple shifts or days
Same principle as the crew scenario, applied across time instead of across people: total every logged entry for that job number, regardless of which day or shift it was logged on, before calculating a percentage. The same SUMIF pattern from above works whether the separate rows come from different people or different days — or both.
One caution specific to multi-day jobs: don't calculate efficiency on a job that's still open. A job that's 60% done will always show inflated or understated efficiency depending on how its hours were front- or back-loaded, because the actual-hours total is still incomplete. Wait until the job is closed, or clearly separate in-progress jobs from a completed-jobs report so the two don't get compared side by side.
Use the result carefully
Efficiency should be reviewed together with quality, downtime, rework, material shortages, and job complexity.
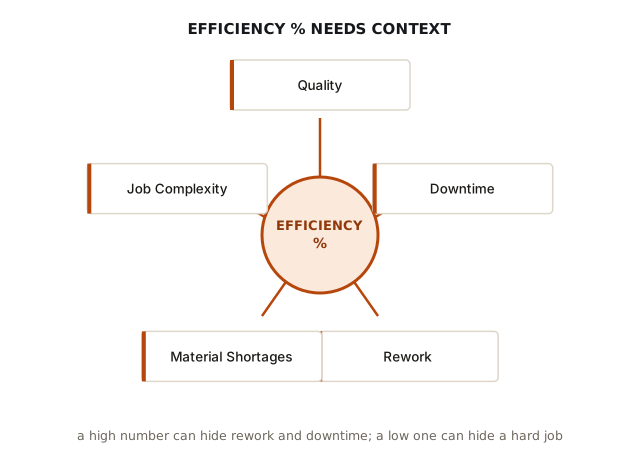
A single efficiency number can't distinguish between an operator working slowly and a job that had a material shortage, unplanned downtime, or necessary rework baked into the actual hours — none of which reflect on the person doing the work, and all of which drag the percentage down. It cuts the other way too: a standard time that's set too generously makes every job look artificially efficient. And if this number gets used to evaluate people rather than to flag jobs worth investigating, it stops being reliable — people learn to pad actual-hours reporting or push for looser planned times, and the metric ends up measuring the gaming rather than the work.